Cost Optimization Maturity Model
In my experience working with Azure global enterprise customers, I see organizations move through several phases of cloud cost-optimization.
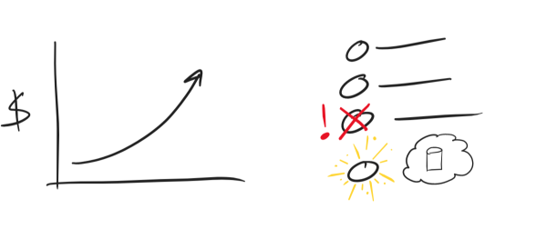
Phase 1 - Freaking Out
The first phase is moving to the cloud and watching the bill grow over time without understanding why. There is not much to do in this phase other than completely ignoring the slowly growing problem or asking for help.
Phase 2 - Finding Tools

Learning about cost management tools distinguishes Phase 2 from Phase 1. Azure includes tools like:
- Documentation of Best Practices
- Azure Advisor
- Azure Cost Management and Billing Portal
- Azure Cost Management (Power BI App)
- Power BI Cost Management Connector (Power BI Desktop)
- Well-Architected Framework Cost Optimization Workbook
- Additional Tools
Documentation
The Microsoft Cloud Adoption Framework (CAF) and the Microsoft Azure Well-Architected Framework(WAF) are excellent sources for cost management best practices.
Azure Advisor
Azure Advisor is my number one go-to product for cost optimization. It monitors predefined best practices, alerts on exceptions, and allows you to remediate issues. In addition, it provides cost recommendations based on your usage and configurations:
- Shut down unused VMs
- Rightsize underused VMs
- Buy Reserved Instances for consistent resources
- Delete idle network gateways
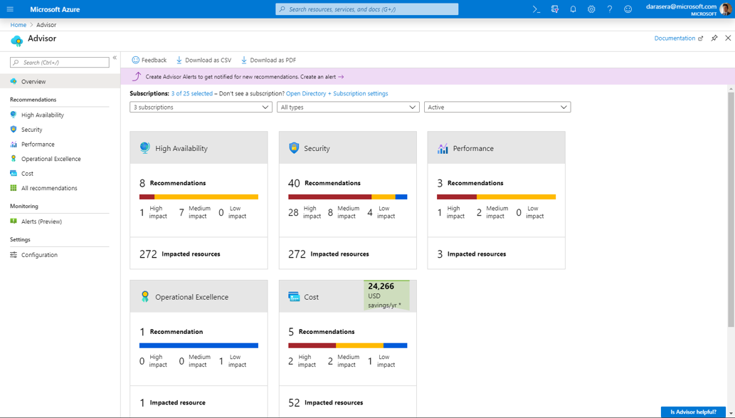
Review Advisor recommendations in the Azure portal: aka.ms/azureadvisor
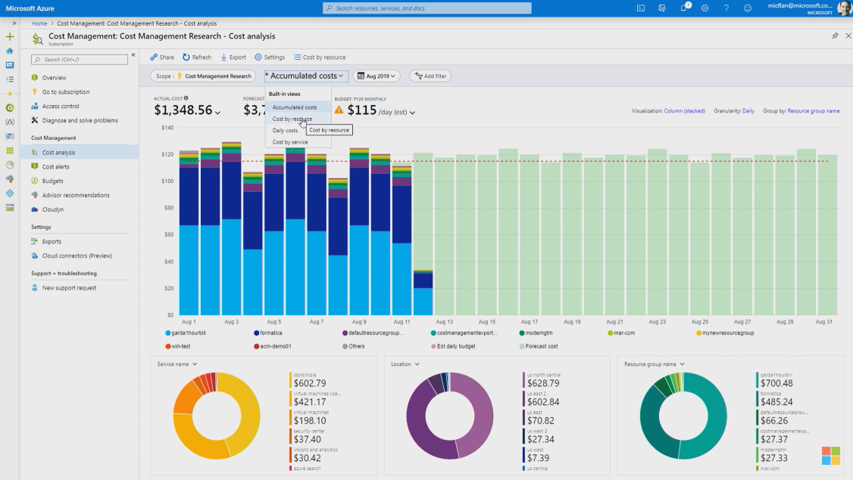
Azure Cost Management and Billing Portal
I can’t keep up with all of the new features in the Azure Cost Management and Billing Portal(ACM). Use it to:
- Explore Cost
- Manage Reservations
- Set spending thresholds and more
Azure Cost Management + Billing Power BI App
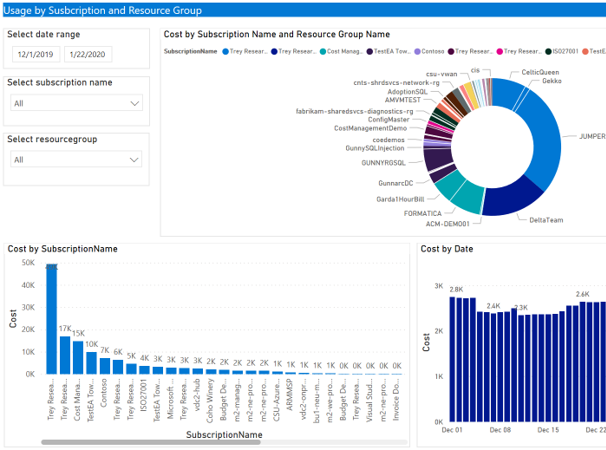
An azure enterprise agreement administrator can run the Azure Cost Management (ACM) Power BI template application by logging into the Power BI Service at https://powerbi.com. The solution connects to the Azure Billing API and has pre-configured reports:
- Account overview
- Consumed Usage by Subscriptions and Resource Groups
- Top 5 Usage drivers
- Consumed Usage by Services
- Windows Server Hybrid License Usage
- VM RI Coverage (shared and single recommendation)
- RI Savings, Chargeback, purchases
- Price sheet
You can also create ad hoc reports using the underlying data. I will use the ACM Power BI Template App to show off how to slice and dice billing data for customers looking for specialized reports.
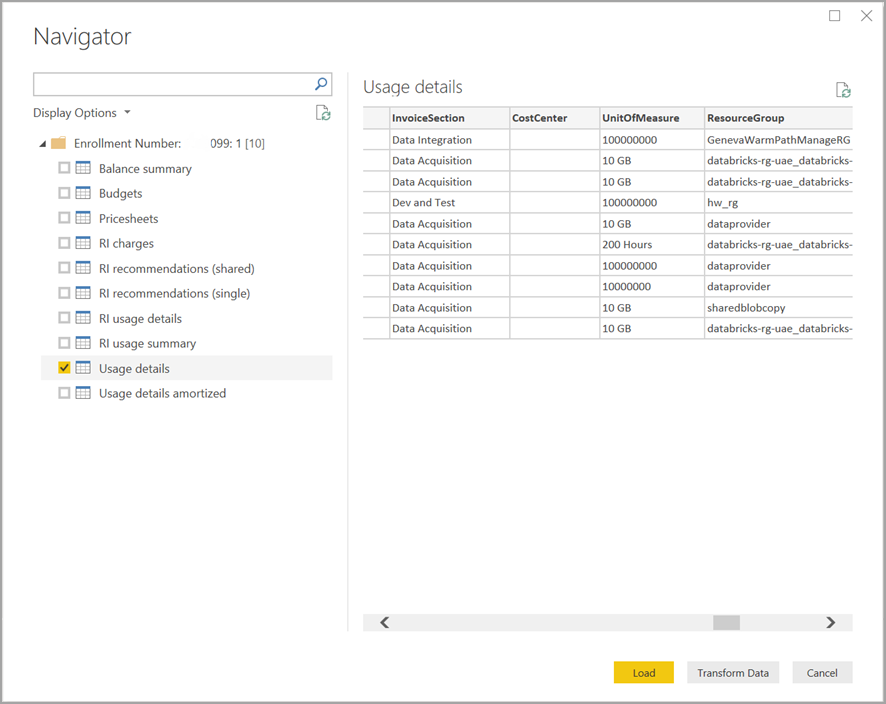
Azure Cost Management Connector for Power BI
When I can’t slice and dice the way I want with the ACM Power BI Template App, I connect to the billing data directly with the Power BI desktop using the Cost Management Connector for Power BI. The connector lets me split and join columns, aggregate data, cleanse data, and any other data preparation I need. Not only can I manipulate the billing data, but I can also join external data sources with my data to create more meaningful reports.
When a tricky request comes in, like a point-in-time comparison report, I fire up Power BI Desktop to do the job.
WAF Cost Optimization Workbook
Microsoft has a service where engineers can sit with customers to analyze their environment. One tool the team uses is the Well-Architected Framework (WAF) Cost Optimization Workbook. The workbook is deployed into Azure Monitor and queries Azure logs and the Azure Graph API to inspect the current environment. Some of the reports include:
- Idle/unattached items
- Orphaned resources
- Unattached Public IPs
- Hybrid benefits and more
Additional Tools
Other goto tools to help better understand costs include
Phase 3 - Outgrowing the Tools

At some point, the tools either fail to provide needed information or are overwhelmed by the amount of data. In my experience, this moment comes when an organization reaches the $2M / month in consumption and the file size for billing data approaches 2-3GB. Excel and PowerBI start to slow down with files this large.
Organizations stay in Phase 3 for various reasons before moving out. The primary reason organizations remain in Phase 3 is because of the coordinating effort to integrate cost-management as part of the strategy and culture of the organization as opposed to looking at it as a one-off activity.
Phase 4 - Create a New Tool
When I faced this phase several years ago, I designed and implemented a solution using my background in big data. After deploying it, I interviewed colleagues in other large organizations asking how they solved the problem. The responses were consistent with my solution’s modern data warehouse pipeline architecture.
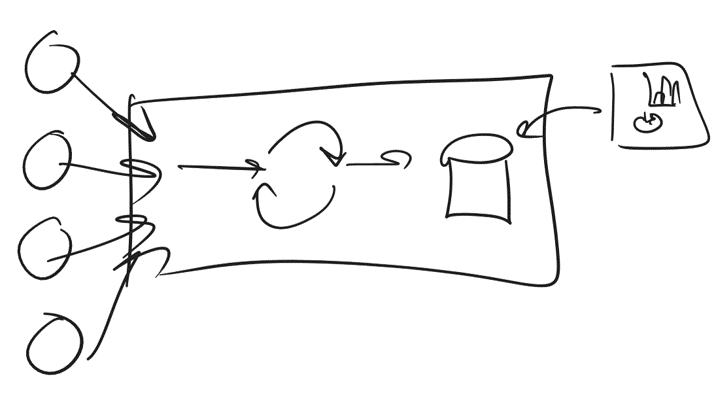
This scalable solution can:
- Ingest data from multiple data sources
- Process and enrich the data
- Persist data in a long-term database
Deploying the pipeline creates more overhead, however, it solves diverse challenges making the cost well worth the benefit. The pipeline scales to ingest growing billing data and growing data sources. Reports are lighting fast because the database is hyper-tuned to the most common queries. This new tool solves most problems but can not fix the one in the next phase.
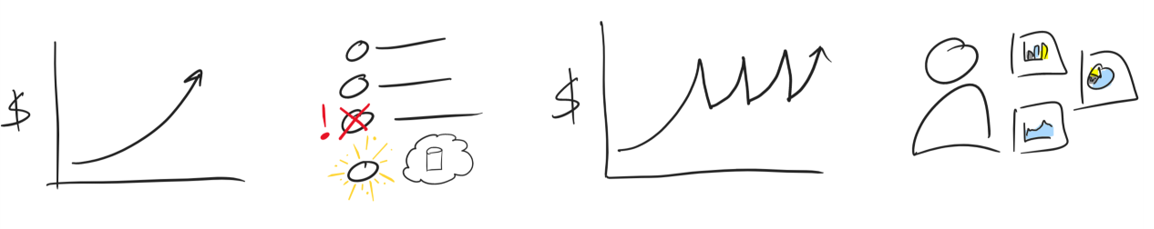
Phase 5 - Wrong Audience
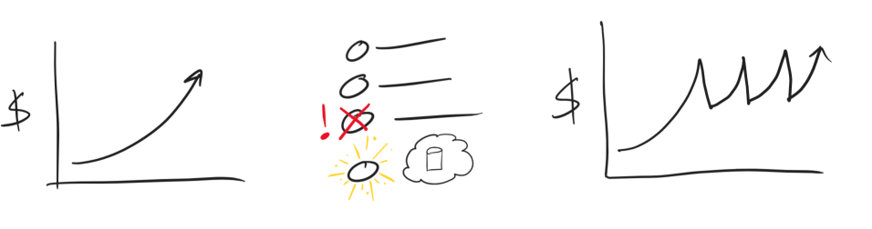
Phase 5 is a cycle of cost-cutting and organic growth. The behavior can show up anytime during the maturity growth phases because it is more of a mindset about cost management instead of a limitation of the tools. I put it here because implementing a big-data pipeline is less complicated than changing the hearts and minds of an entire organization.
Moving through this phase will require:
- Teams focusing on delivering value
- Organizations to understand that spending money is not a problem
- Providing different tools to different audiences
- Leaders to execute against a Strategy
A good leader does not want to arbitrarily cut costs because it negatively impacts teams, is a poor way to measure successful business impact and lacks a strategy.
Unpredictable cost-cutting impacts teams by taking away time from activities that create business value. In addition, cost-cutting forces cost-efficient teams to sacrifice reliability, functionality, or security to meet the cost-cutting goals.
Measuring cost is an important part of running a successful business but is the wrong measurement for the various departments delivering business impact. Executives, operation teams, development teams, and analysts have different needs.
Generally, executives have no problem spending money on an investment they trust. The cycle of cost-cutting and organic growth indicates a lack of confidence in the cloud and the team managing it. Leaders need key performance indicators (KPIs)s focused on business best practices to help them trust the cloud investment.
Cloud operation teams need to monitor and enforce corporate standards and policies. They want tools to help them with chargeback models of cloud costs.
Development teams need reports that show how to comply with standards, implement best practices, and remediate alerts. Teams also need the flexibility to integrate small positive changes each sprint without impacting feature development.
Analysts need tools to explore the data and find edge cases to inform future strategies.
Each department has different priorities around understading cloud usage and cost, performance tracking, and cloud optimization. The key is to move from arbitrary cost-cutting to a clear strategy.
Define a Strategy
Moving from seeking and destroying cost to strategic thinking requires a three-phased approach:
- Define Best Practices
- Measure and Monitor
- Remediate
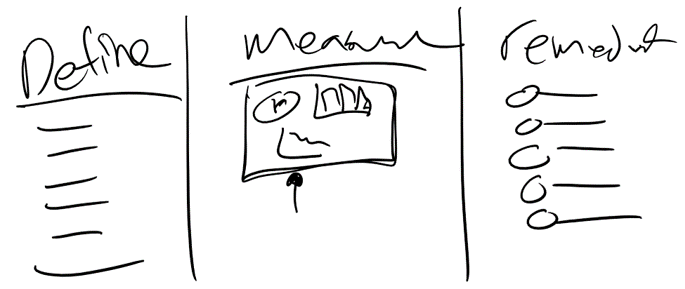
This method extends the capability of Azure Advisor to include custom business best practices.
Best Practices
Define best practices agnostic to technology and in a way everyone can agree on. For example:
- Turn off Development Machines on the Weekend
- Resize VMs to have high utilization
- Apply reservations recommendations
See https://aka.ms/architecture/framework for more.
Measure and Monitor
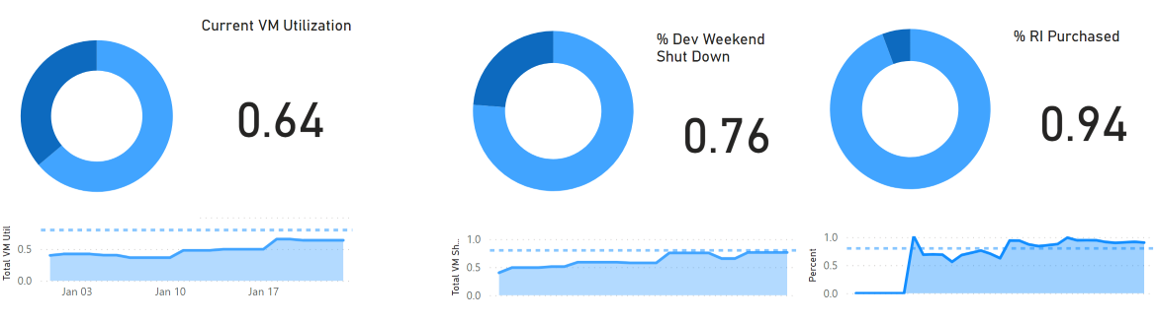
The best visualizations provide essential information each department needs. Reports designed to build trust for executives should show the current status of a best practice and the historical progress. Provide visualization that provides information needed to make real-time decisions.
Organizations move out of phase 5 when it replaces the mindset of seeking-and-destroying costs to strategically monitor and measuring best practices.
Phase 6 - Recipes
The last phase in the maturity model is when an organization can scale developing reports that measure best practices. Scaling will require centralizing data collection, a common data schema, and discoverability. In this environment, teams can create, discover, and share new reports.