Cost Optimization Strategic Thinking
This post will outline how to develop a strategic approach to manage costs in cloud services.
I previously talked about the maturity path organizations go through when adopting Cloud Cost Optimization. Since then, I’ve created a session and workshop guiding executive teams on how to have a strategic mindset for Cost Optimization. They gain the ability to:
- Recognize the current organization mindset
- Understand how to develop strategic based reporting using primary cost drivers
- Establish a framework to capture and prioritize requirements.
Move Away From Firefighting
Often, I am contacted by customers who feel overwhelmed and frustrated, they might share something like:
“Help! Our storage cost is too high.”
“Help! Our compute is underutilzed.”
“😱! Our ☁️ is too 🤑.”
“😭!! ⛈️ 💵 📈 🤯 😖 🔥 😵💫”
When I hear this, I know the organization isn’t following a strategy. They are in a “seek and destroy” cost mindset chasing anything that looks like it will save cost. These groups are asking for tools to deploy or building large complex dashboards that can slice and dice data a hundred different ways. It’s an environment that feels like a constant fire fight against a runaway inferno.
I completely understand the complexity of cloud cost management and the difficulty in knowng where to start. The most successful organizations move from a “seek and destroy” mindset towards developing and executing a strategy.
Strategy built around Best Practices
A popular strategy is to:
- Define Best Practices
- Measure or Monitor compliance to the best practice
- Define and Implement Remediation methods
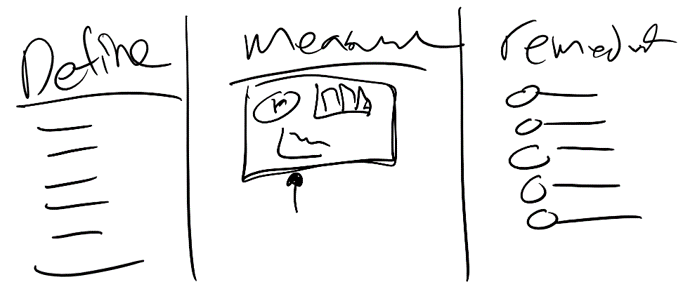
This approach changes traditional reporting by turning it into measuring compliance with best practices. Additionally, it creates a place for organizations to define how to remediate in the event they are not in compliance. Leadership teams love this approach because it is nothing more than defining a plan, measuring progress, and creating playbooks to stay on target. It’s data driven, promotes team accountability, and focuses on outcomes.
Defining best practices can be difficult and is sometimes more art than science. One technique I like to use is to look at the primary cost drivers of a service.
A Primer on Cost Drivers
Most services have several different drivers that go into the final cost. These can typically be found in the documentation or pricing calculators.
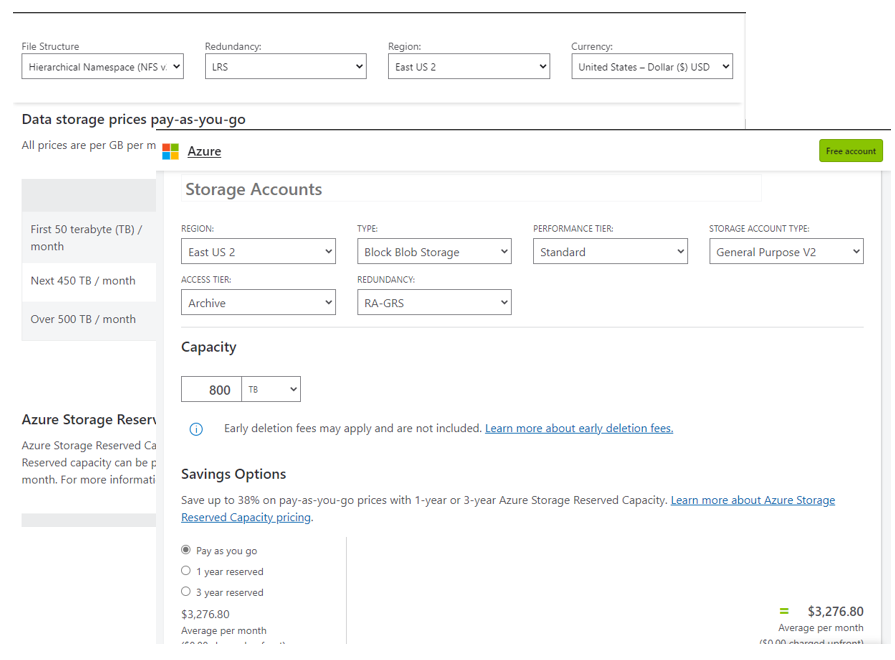
For example, in Azure Blob Storage, the primary cost drivers include file structure, redundancy, region, access tier, capacity, reservation, and operations. I wrote a small tool to help me identify the primary cost drivers for storage using a technique called feature reduction.. Turns out the primary cost drivers for storage are:
- Capacity
- Access Tier
- Redundancy
- Region
- … all others
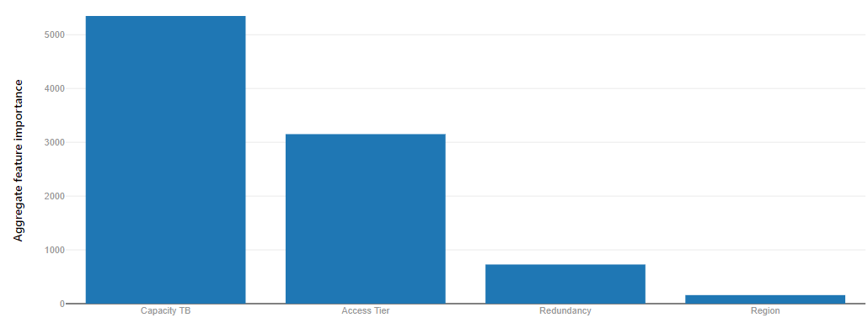
It makes sense that capacity is the top cost driver because the more data I put into storage the more it’s going to cost. I was surprised to see that access tier had a larger influence on cost than redundancy.
Identifying the cost drivers is useful in a few ways:
- Allows breaking down the problem into smaller, more manageable pieces.
- Helps prioritize efforts and develop a roadmap based on the relative impact of each cost driver.
- Provides a starting point to brainstorm best practices
Example From Driver to Best Practice
In our quest to develop a strategy we will implement the powerful leadership principle of “Do what you say you will do” and use our top cost drivers to define the best practices we will follow. For each cost driver, consider not only how you can influence cost, but how do you want to run your organization.
Brainstorm activities for each Storage Cost Drivers
| Driver | Activity |
|---|---|
| Capacity |
|
| Access Tier |
|
| ... | ... |
Define Best Practices from brainstorming activity:
| Activity | Best Practice |
|---|---|
| Reduce Capacity | As an organization have 50% of data stored in a compressed format (snappy, gzip, lzo, etc.) |
| Reduce Capacity | As an organization have 95% of data active retention age and 5% expired |
| Reserve Capacity | As an organization have 80% Reserved Capacity for all eligible storage |
| Organize Tiers | As an organization have 90% Aligned Data |
| Automate Tiers | As an organization have 95% data with lifecycle policies applied |
We now have a collection of best practices to follow. Setting a goal means nothing if it isn’t tracked.
Measure Compliance
The management guru Peter Drucker once said,
“If you can’t measure it you can’t improve it.”
Our task now is to measure our compliance to the best practice standards we have defined. This is the steps that looks most similar to traditional reporting because we will create visuals. The most effective visuals need to incorporate the follow capabilities:
- Separate composite metrics into atomic units. Ie.
total_costintoquantityandunit_cost. - Display service level indicators,
SLI, as a percentage. - Prefer fewer
SLIstates. Ideally no more than three. - Display Historical Trends. This is key in building trust for leadership.
- Forecast next period’s
SLIand Cost - Calculate Organization service level objective
SLOand Cost - Calculate cost if the organizaton meet its
SLO. - Display Potential Savings
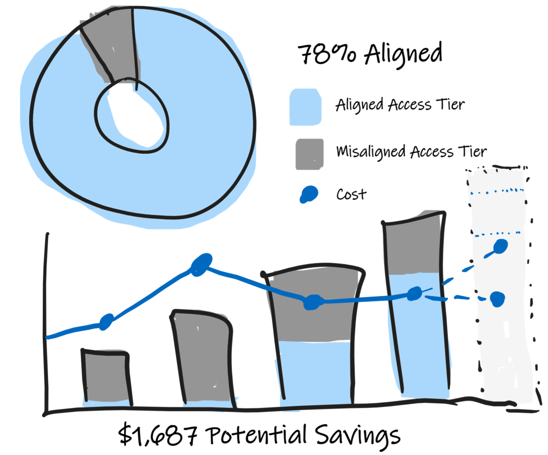
As an organization have 90% Aligned Data
This chart shows the organization aligned data SLO of 95%. We can see the current SLI is 78% aligned an 22% misaligned.
It also shows historic values for Quantity, SLI State, and Cost. This breakout is useful because teams may spend a lot implementing cost improvements but cost remain the same or worse go up. By breaking out quantity from cost, teams can demonstrate to leadership the improvements in efficiencies.
For instance, between the second and third months, Cost went down but the total footprint incrased. This happened because the team improved the percentance of aligned data effectivly lowering the unit cost theirby lowering total cost.
Finally, the forecast shows the expected growth in the environment for total storage, along with the expected aligned data and the associated costs. It then shows what the cost would be if the organization achieved it’s target SLO of 95%.
The diffeence between the forecast and the target is the potential savings of $1,687.
Following these standards in visualising best practices has the following benefits:
- Leadership and Operations teams can priorities efforts to target improvements that have the largest potential savings
- Operations team can demonstrate optimization efforts that oftentimes gets lost when strickly looking at cost
- Reports are Action oriented to improve SLO. Leaders love this approach
- Standard SLI provide a common language to the organization that allows teams to create new Best Practices and SLO
Remediate the Offence
In the event there is a missed SLO the most successful organizations establish a plan on how to meet the target. This could look like:
- Defining Run-books
- Instructions on how to apply an Azure Policy
- Links to documentation on how to enable ‘Auto-shutdown’
Generally there is a central team who is defining the best practices and remediations and the downstream teams attempt to comply with the best practices.
The point is to give the downstream team the tools or information to be successful.
Finally a Strategy
We now have a strategy and information to guide the implementation. Our strategy is:
- Define Best practices based on primary Cost Drivers. Captured as
Service Level Objectives - Measure our Compliance to the
SLOand show potential cost savings between forecasted cost and SLO objective cost - Publish and implement remediation methods.
With the strategy in place mature organizations establish a framework to capture requirements and scale beyond the core team.
Recipes for Best Practices
I’ve been using the term Recipe to describe the various request organizaton have asked me for help with cost optimization. These include the best practices established in our strategy. Some of these are:
- I want to turn of dev machines on the weekend
- I don’t want premium storage in dev environments
- Help me save cost by removing orphaned disks
The framework for a recipe is:
| Section | Detail |
|---|---|
| Overview | Define the Best Practice, SLO |
| Visualization | Show what it should look like |
| Data Schema | Define the minimum data set required to create the visual |
| Data Source | Is this a database, web server, etc. Including version. |
| Data Transformation | Show how to convert from the source data to the data schema |
| Remediation | Steps to comply with SLO |
Example: Orphaned Disks
Overview
Best Practice: As an organization, have 90% attached disk (<10% orphaned)
Sketch
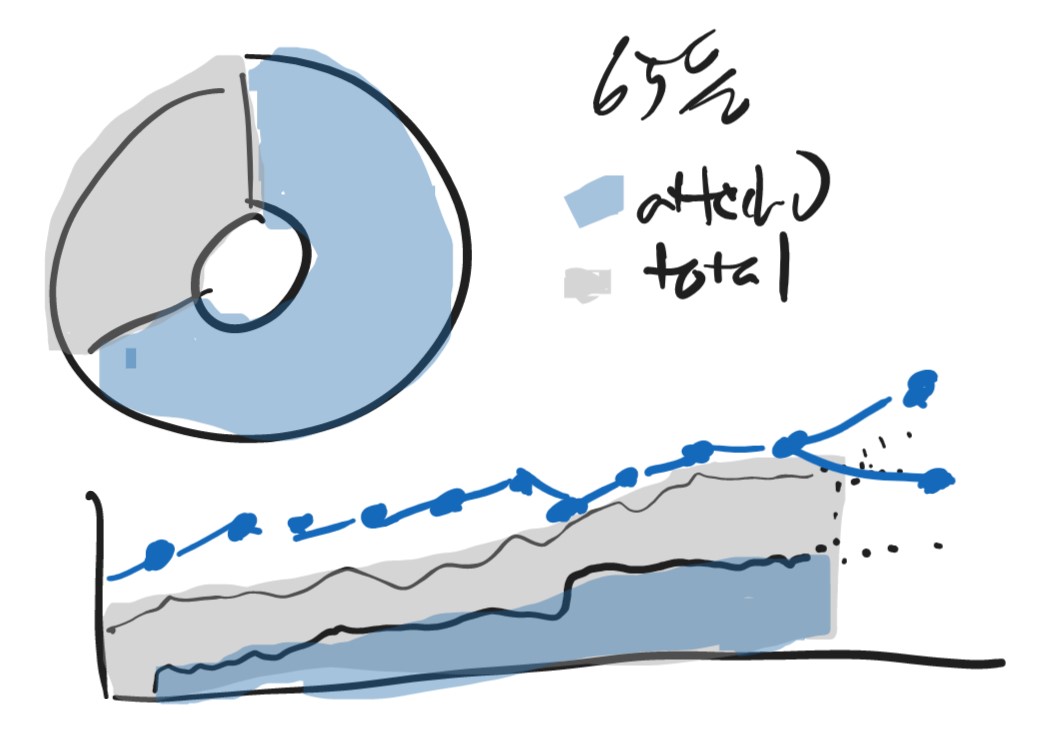
PowerBI Example
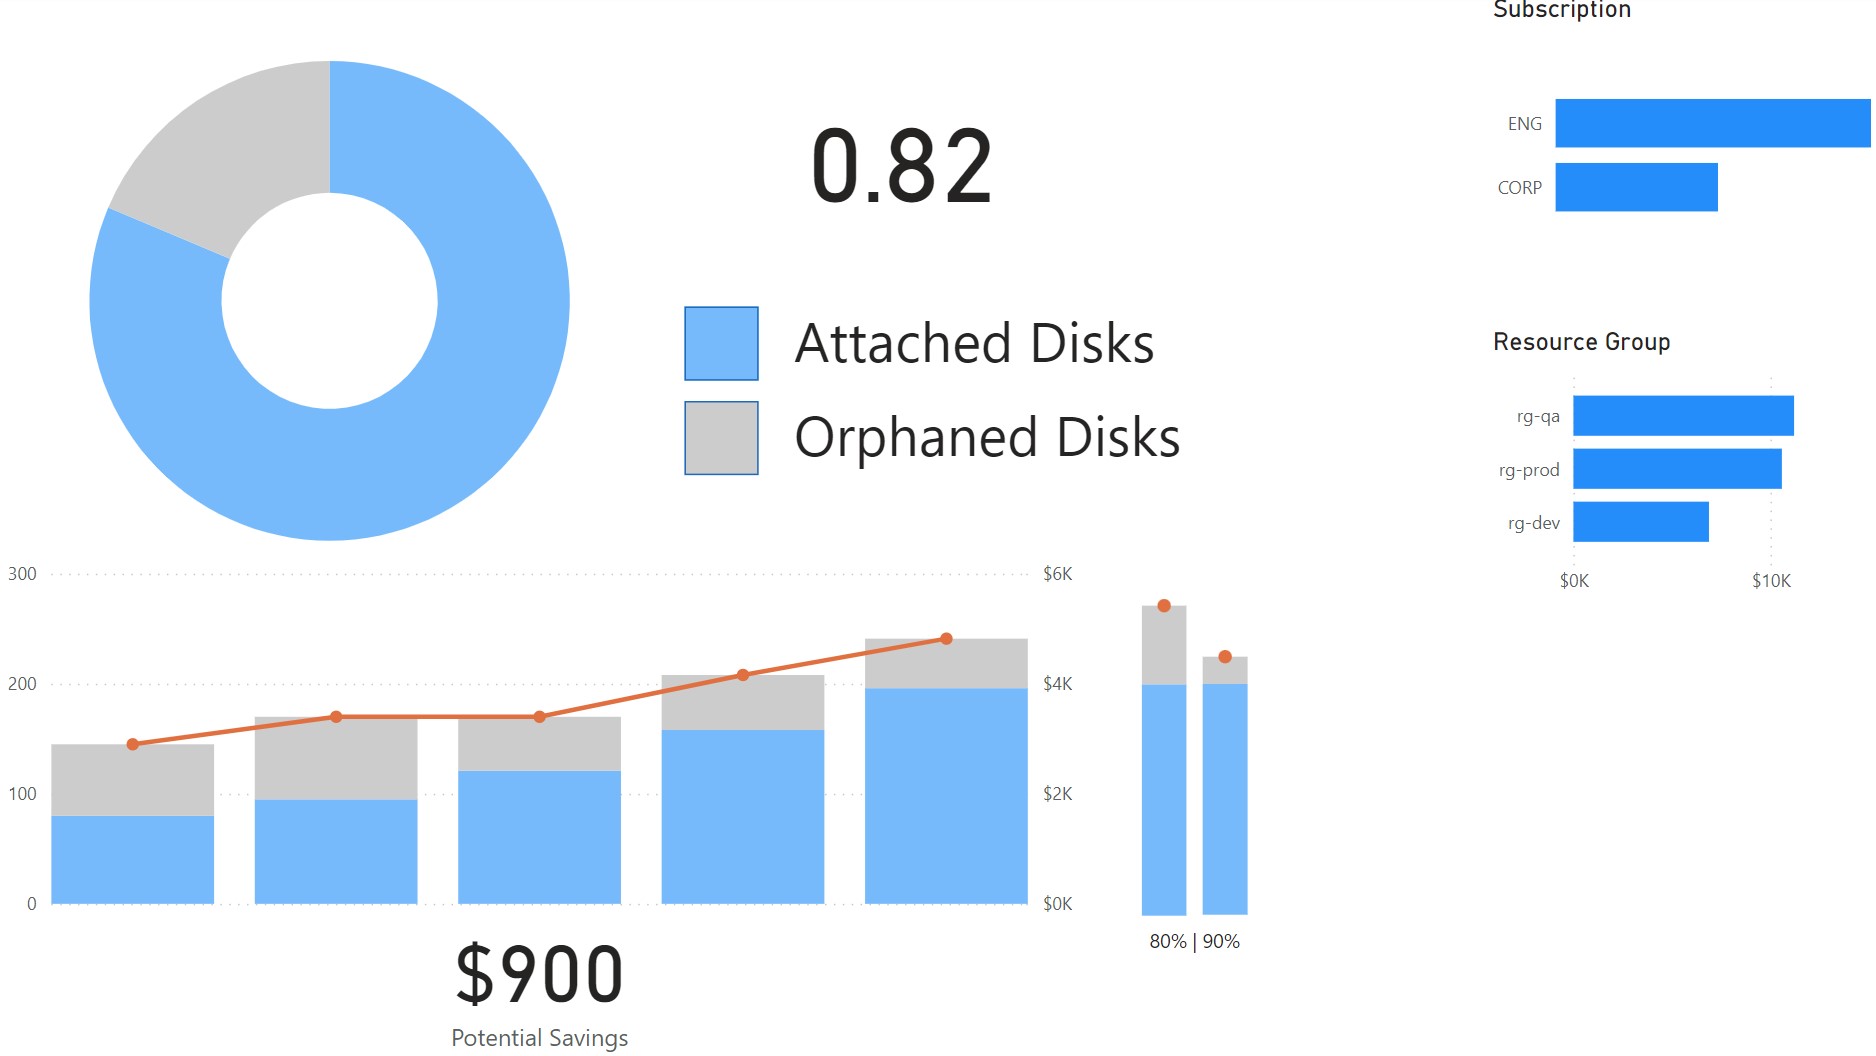
Schema
Parameters may include:
optimal_percentageAs the target to compare cost
| Field | Type | Notes |
|---|---|---|
| date | ||
| subscription_name | Filter | |
| subscription_id | nvarchar(100) | Filter |
| resource_group | nvarchar(100) | Filter |
| orphaned_disk_count | ||
| attached_disk_count | ||
| total_disk_count | Calculated orphaned + attached | |
| attached_disk_percent | Calculated attached / total | |
| cost | ||
| is_forecast | Forecasted data | |
| is_latest | Indicates the most recent data | |
| is_optimal_forcast | Indicates optimal forecast | |
| forecast_cost | Calculated cost if record is_forecast=True and is_optimal_forecast=False | |
| optimal_cost | Calculated cost if record is_forecast=True and is_optimal_forecast=True |
Example Data
| Date | SubscriptionName | SubscriptionId | ResourceGroup | Total Disk Count | Orphan Count | Attached Count | AttachedDiskPercent | Cost | IsForecast | IsLatest | IsOptimalForcast | ForecastCost | OptimalCost |
|---|---|---|---|---|---|---|---|---|---|---|---|---|---|
| 1/1/2023 | CORP | /subscriptions/00000000-0000-2222-0000-000000000000 | rg-dev | 10 | 5 | 5 | 50% | 200 | FALSE | FALSE | FALSE | 0 | 0 |
| 1/1/2023 | CORP | /subscriptions/00000000-0000-2222-0000-000000000000 | rg-prod | 20 | 8 | 12 | 60% | 400 | FALSE | FALSE | FALSE | 0 | 0 |
| 1/1/2023 | CORP | /subscriptions/00000000-0000-2222-0000-000000000000 | rg-qa | 20 | 7 | 13 | 65% | 400 | FALSE | FALSE | FALSE | 0 | 0 |
| 1/1/2023 | ENG | /subscriptions/00000000-0000-2222-0000-000000000003 | rg-dev | 7 | 3 | 4 | 57% | 140 | FALSE | FALSE | FALSE | 0 | 0 |
See full dataset path/to/sample/dataset.csv
Source Data
| Source | Version | Details |
|---|---|---|
| Common Data Schema | Latest | AmortizedCost table |
| Azure Graph API Query | v1.0 | resources |
AmortizedCost SQL Query
SELECT
  [Date]
  , [ResourceId]
  , SUM([CostInBillingCurrency]) as Cost
FROM
  [AmortizedCost]
GROUP BY
  [Date]
  , [ResourceId]
Azure Graph API Query
resources
| where type has "microsoft.compute/disks"
| extend diskState = tostring(properties.diskState)
| project current_date = format_datetime(now(), 'yyy-MM-dd'), subscriptionId, resourceGroup, id, sku_name = sku.name, diskState, managedBy, is_orphaned = (diskState == 'Unattached' or managedBy == "")
Transformation
Join AmortizedCost table and Azure Graph API Query by ResourceID and Date
SELECT
  a.[date]
  , a.[subscription_name]
  , a.[subscription_id]
  , a.[resource_group]
  , b.[is_orphaned]
  , SUM(a.[CostInBillingCurrency]) as cost
FROM
  [AmortizedCost] as a
JOIN
  GRAPH_QUERY as b
ON a.date = b.date and a.resource_id = b.resource_id
GROUP BY
  a.[date]
  , a.[subscription_name]
  , a.[subscription_id]
  , a.[resource_group]
  , b.[is_orphaned]
Remediation
- Delete Disks
az vm disk delete --id $disk_resource_id
Benefits
This is a long post to really just guide organizations in developing a strategy around cost optimization and move away from a reactionary seek and destroy mindset.
It boils down to:
- Use primary cost drivers to create best practices
- Use the recipe format to define SLOs
If you do this then you enjoy the benefits of:
- Standardize data set
- Data lineage
- Clearly defined SLI and SLO
- Easier to validate and confirm data errors
- FinOps teams can define requirements as recipes and hand off implementation to data analytics team
- Standard schema and recipe format allow to scale new requirements
- Business focuses on acheicing SLO instead of chasing fires
- Roadmap based on Top Spend and Top cost drivers
Appendix
| Term | Definition |
Service Level Indicator (SLI) |
Clearly Defined Quantitative measurement |
Service Level Objectives (SLO) |
Target value |
Service Level Agreement (SLA) |
Targets and consenquences promised to users |