A Tour of JMeter - Part 1
I recently had a task to test the performance between two different solutions. After looking around at several tools, I settled on Apache JMeter. It took a while learning the tool. However, I found it to be extremely useful once I got the idea of how it worked.
This tour is broken into several sections
- Installing and Recording (This post)
- First Test Run
- Improving the Test Run
- Advance Techniques
Install
You can quickly start recording web interactions in less than 10 min with the tool. Run these commands in your console.
wget http://apache.opensourceresources.org//jakarta/jmeter/binaries/jakarta-jmeter-2.4.tgz
tar zxvf jakarta-jmeter-2.4.tgz
cd jakarta-jmeter-2.4 $ bin/jmeter
Bam! That fast.
Record
When JMeter starts, there are two nodes for you to play with.
| Test Plan | This is what is saved as your test and where all the meat goes. |
| Work Bench | I used this area to record browser actions |
Recording is just configuring JMeter to listen to the browser and configuring the browser to send info to JMeter.
- Add A Proxy in JMeter
- Right Click on the Workbench and select Non-Test Element
- Select HTTP Proxy Server
You can configure the Proxy Server different ways. Just stick to the defaults for now.
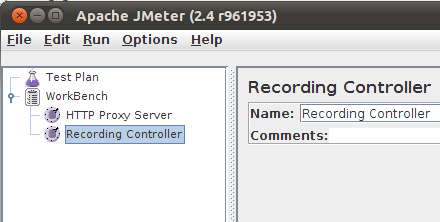
- Add a Place to capture the recording
- Right Click on the Workbench and select Logic Controller
- Select Recording Controller
You should now have two elements.
-
Configure the Browser to Record In FireFox this is done with Edit -> Preferences -> Advance -> Network -> Settings -> Manual Proxy Configuration.
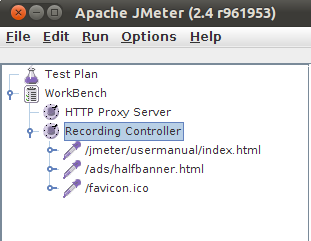
- Record Something
- Navigate to JMeter User Manual
JMeter now has your actions recorded
That’s it. You have install, configured and used JMeter to record some browser actions. Next we’ll go into running what was recorded.